The Effects of Price Changes
If you are going to change your prices, there are two ways to go: down or up. I list “down” first because I have found people more willing to reduce their prices than to raise them. The willingness to discount prices and the reluctance to raise them are based at least in part on the lack of good information. The tables below shed some light on the subject.
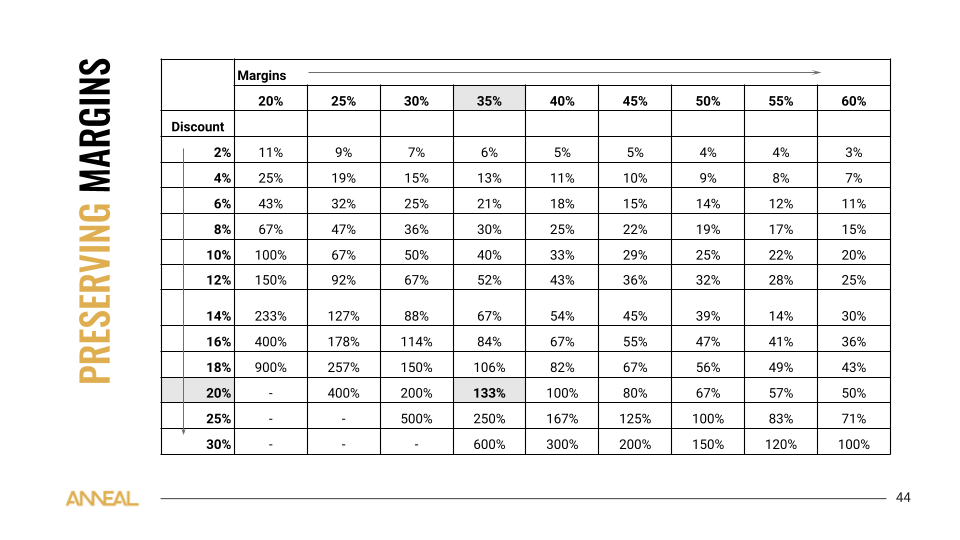
The effects of discounts on profit
Why do people discount their prices? I’ve asked hundreds of business owners and managers that question, and the answers are always the same: We discount prices to attract more customers. If attracting more customers is the purpose of discounts, wouldn’t it make sense to know, in advance, how many more customers you’d have to attract to at least breakeven on the cost of the discounts? The table below tells you, and you may be surprised.
To use the table, find your gross profit margin* in the top row and your planned discount percentage in the left column. The intersection of the row and column in the table tells you how much more you would have to sell to make the same profit as before the discount. For example, we’ve highlighted a 35% margin and a 20% discount. The number in the intersection is 133%. That tells you that you’d have to sell 133% more just to make the same profit you make now. Is working double plus one-third for the same profit what you had in mind when you came up with your discount promotion?
The effects of price increases on profit
Why are people reluctant to raise their prices? I’ve also asked that question hundreds of times, and the answers are always the same: We are reluctant to raise prices because we fear losing customers. If fear of losing customers keeps you from raising prices, wouldn’t it be useful to know how many customers you could lose before the lost sales reduce your net profit? The table below tells you.
Use this table the same way as the discount table above: Find your margin in the top row and your planned price increase in the left column. The intersection of the two in the table tells you how much less you can sell and make the same profit as before the price increase. For example, we’ve highlighted a 35% margin and a 10% price increase. The number in the intersection is 22%. That means you could lose 22% of your sales and still make the same profit as you do now. Would that information give you the confidence you need to test higher prices?

The dramatic effects of price changes are not immediately obvious to most of us, but there are clear reasons for both. The dramatic effect of discounting is because all of the discount comes out of your margin while variable costs remain the same. After all, just because you chose to discount your prices to customers doesn’t mean your employees and suppliers chose to discount their prices to you.
The dramatic effect of price increases is due to the fact that higher prices, unlike higher sales, do not increase variable costs. If a company is operating at or above break-even point, every penny of a price increase flows directly to net profit.
Hang on to this article and these tables. You may not need them now, but the next time you’re planning a price change - up or down - pull out the charts and run the numbers. Ask yourself, for example: “Can I reasonably expect to sell at least double plus ⅓ more with a 20% discount?” or “Will I really lose 22% or more of my customers due to a 10% price increase?” The tables can’t tell you what you will sell, but they give you good information to factor into your pricing decisions.
* To calculate your margin, find gross profit and loss statements on your income statement and divide that number by total sales.
Pricing decisions shaped by fear are expensive decisions. Get clarity on the real profit impact of your next price change. Schedule a call and let's run the numbers together.